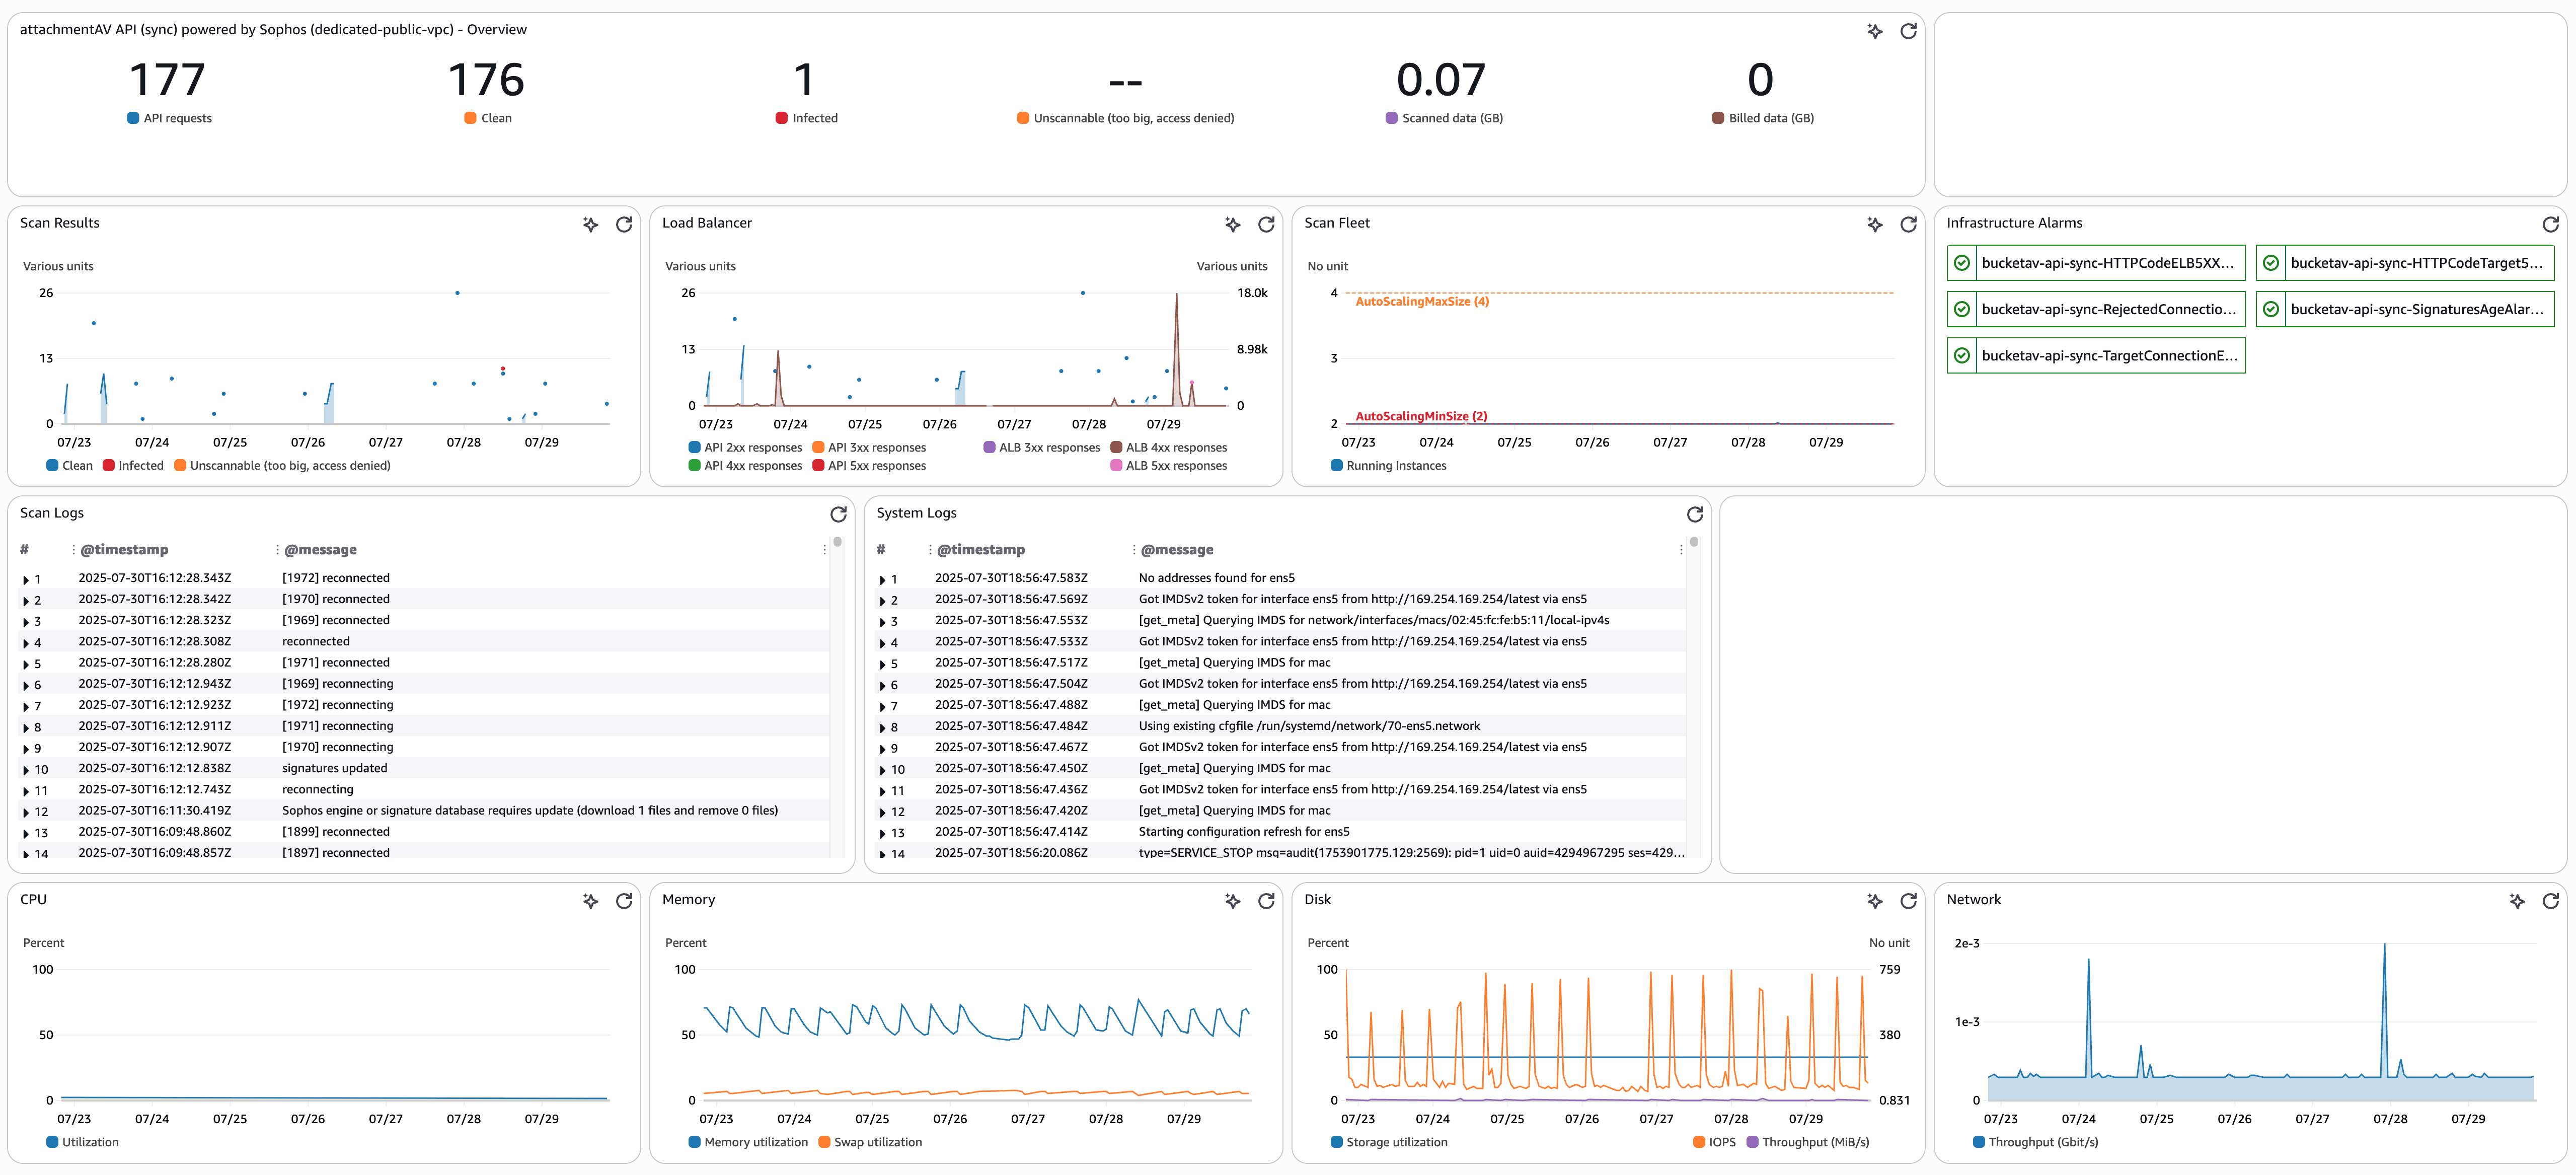
API (Self-hosted on AWS): Dashboard
The dashboard provides a real-time overview for operators over:
- Scan results: Number of clean, infected, and unscannable files.
- Load Balancer: HTTP responses from load balancer and targets (Scan Fleet).
- Scan Fleet: Number of EC2 instances running.
- Infrastructure alarms: Shows the state of all the CloudWatch Alarms created by attachmentAV API for infrastructure monitoring.
- Scan logs.
- System logs.
- CPU, memory, disk, and network utilization.
The Load Balancer, Scan Fleet, infrastructure alarms, system logs, CPU, memory, disk, and network utilization are most important from an operational perspective.
To open the dashboard:
- Visit the AWS CloudWatch Management Console.
- Navigate to Dashboards.
- Select the dashboard starting with the name
attachmentavfollowed by the name of the AWS region—for example,attachmentav-eu-west-1.